Video projectors have multiplied over the past ten years, whether for lectures, presentations of research work, presentations in companies.
The projection conditions are very variable, whether on the projection ratio (4/3 or 16/9), the size of the screen on which the image is projected, or the definition of the projector (HD, 4K).
The size of the projection room is also variable. They rarely communicate this information to the speaker, which should be the case so that he/she can adapt the content of his presentation to this environment.
I thus recently wondered what would be the best way both to communicate about this environment but also how to evaluate it.
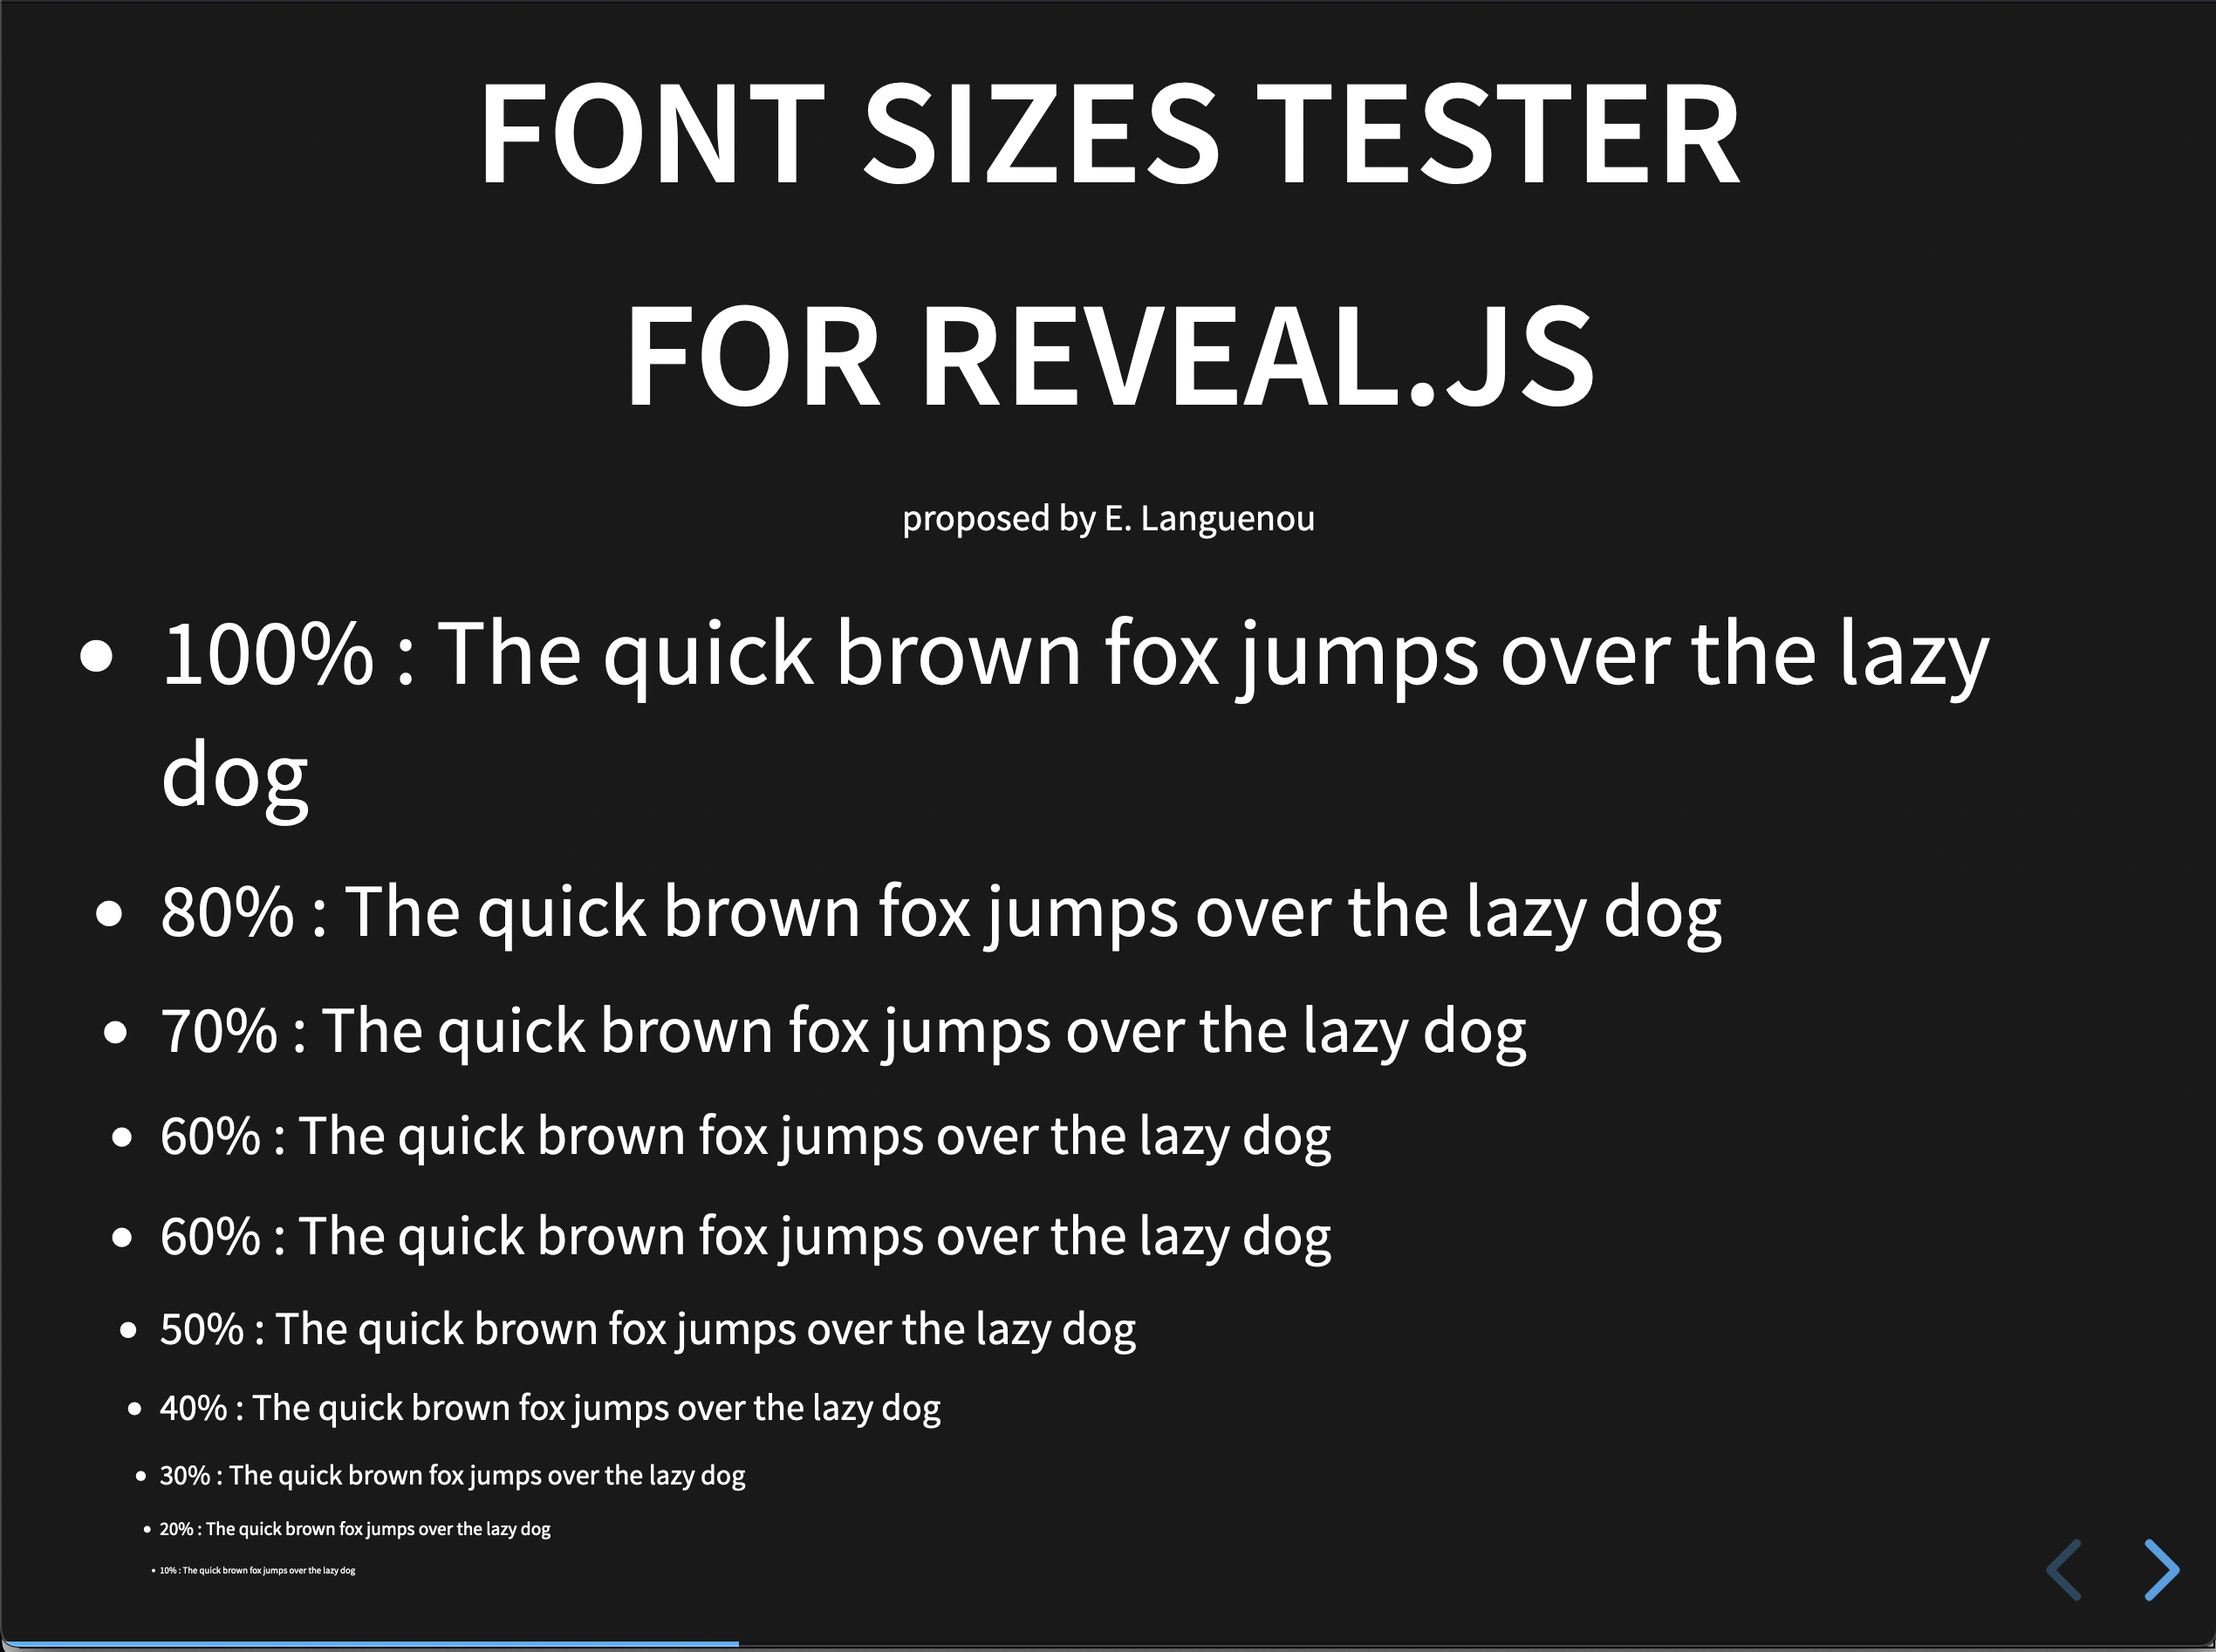
It is considered that a person with normal vision can decipher text 6mm high from 4m away, which gives us a limited visual angle for easy reading. Thus, the communication of the angle formed by the screen, for a spectator at the back of the room, would suffice to deduce the minimum size of the texts appearing on the screen.
But few of us have a tool that makes it easy to measure a visual angle from our eye. We could calculate it using the distance to the screen and the vertical size of the screen. Anyway, accessing this information could be a bit of a pain.
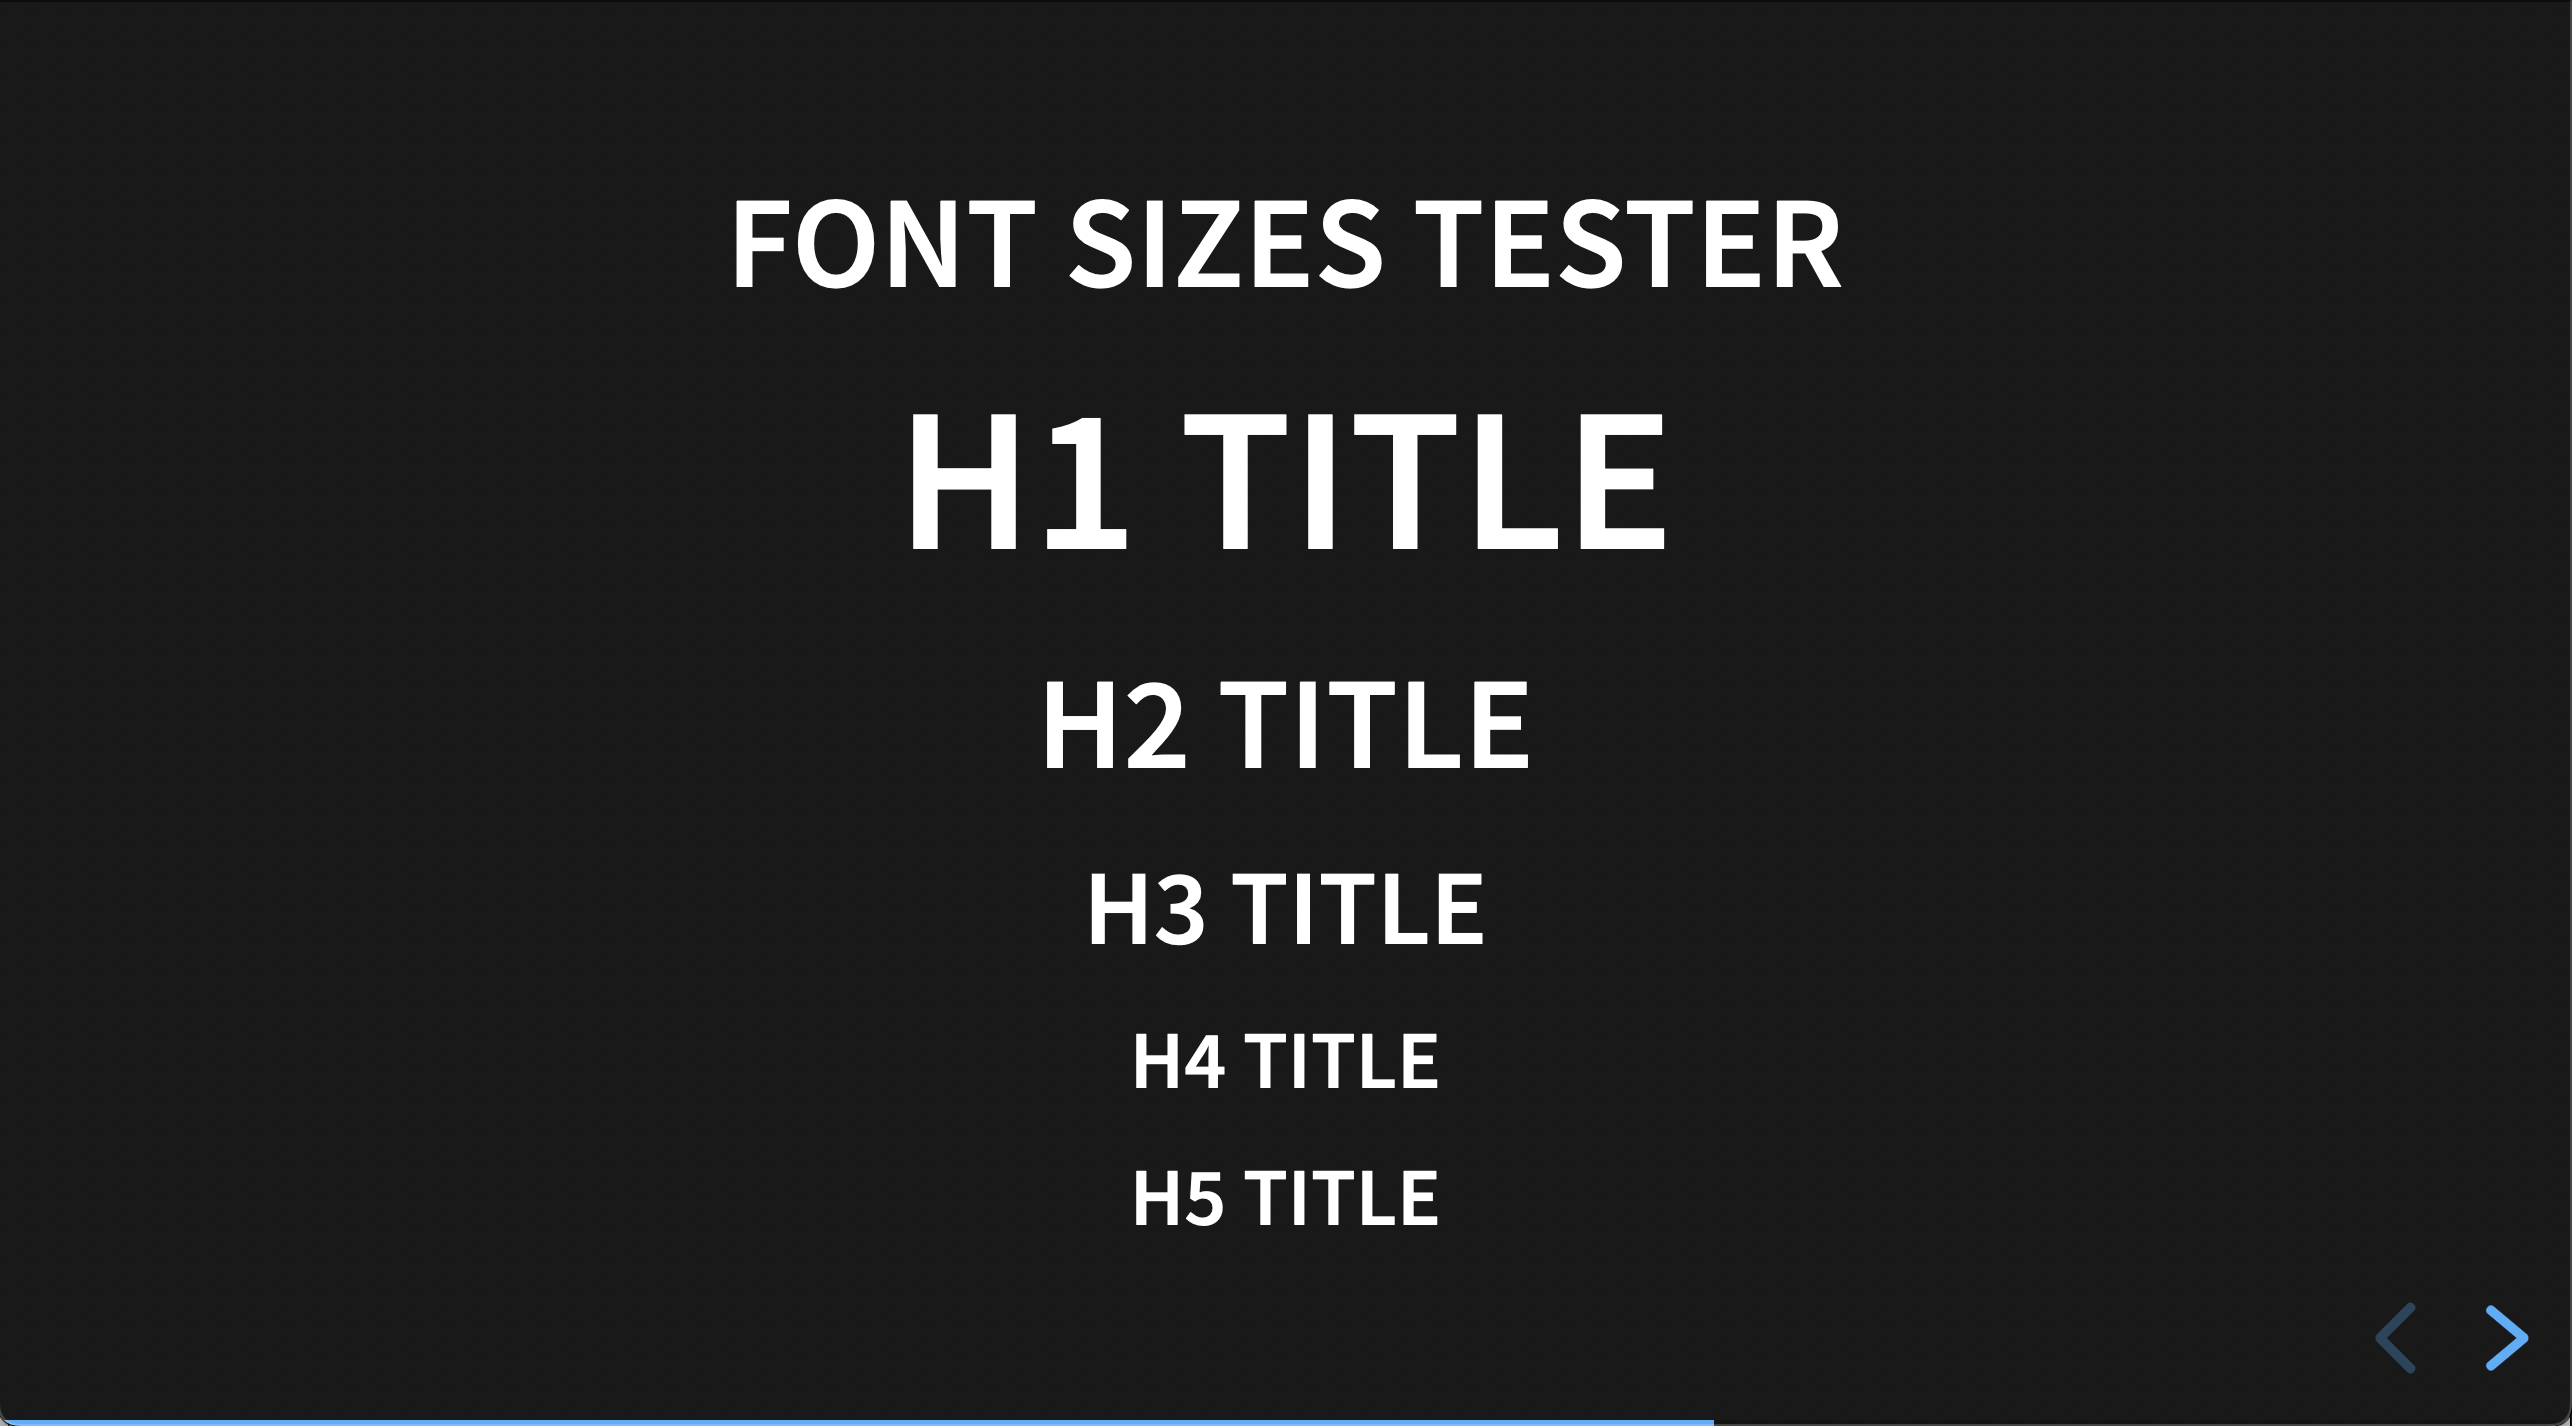
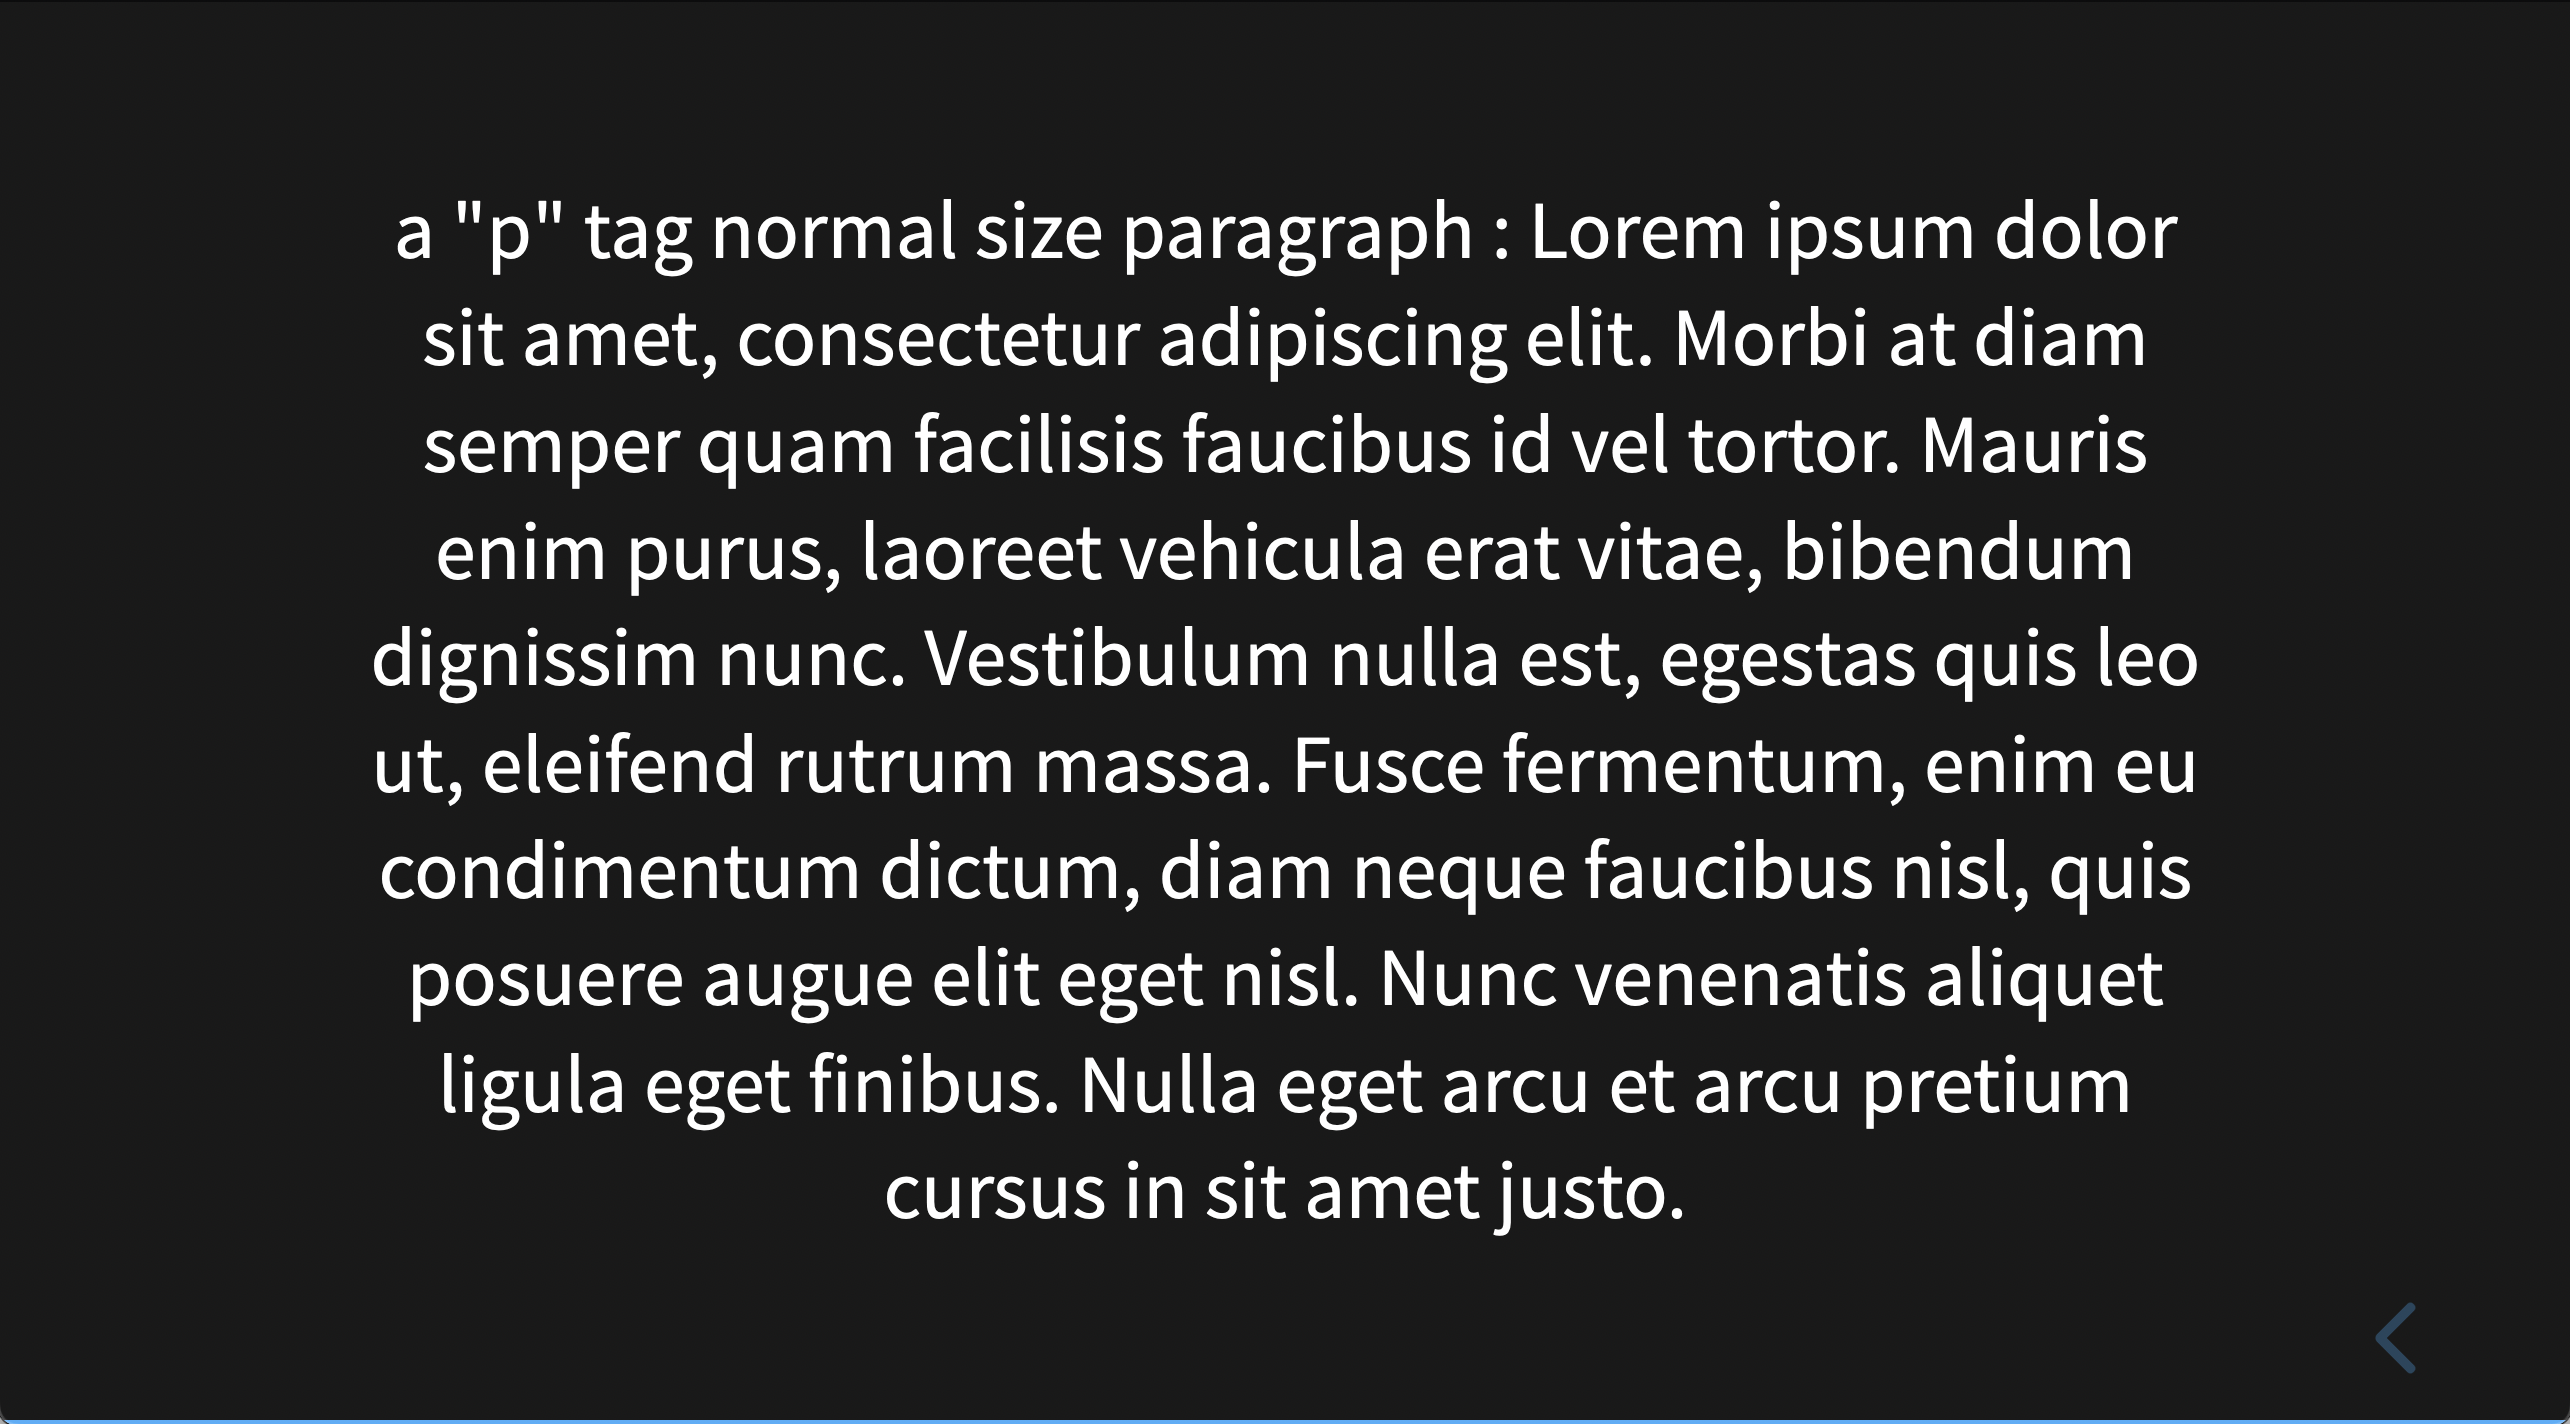
Hence, the convergence towards the creation of projection environment test pages, made for various presentation creation tools and for the two projection ratios (4/3 and 16/9):
beamer (presentation in latex, a text compiler)
libreoffice
keynote (apple)
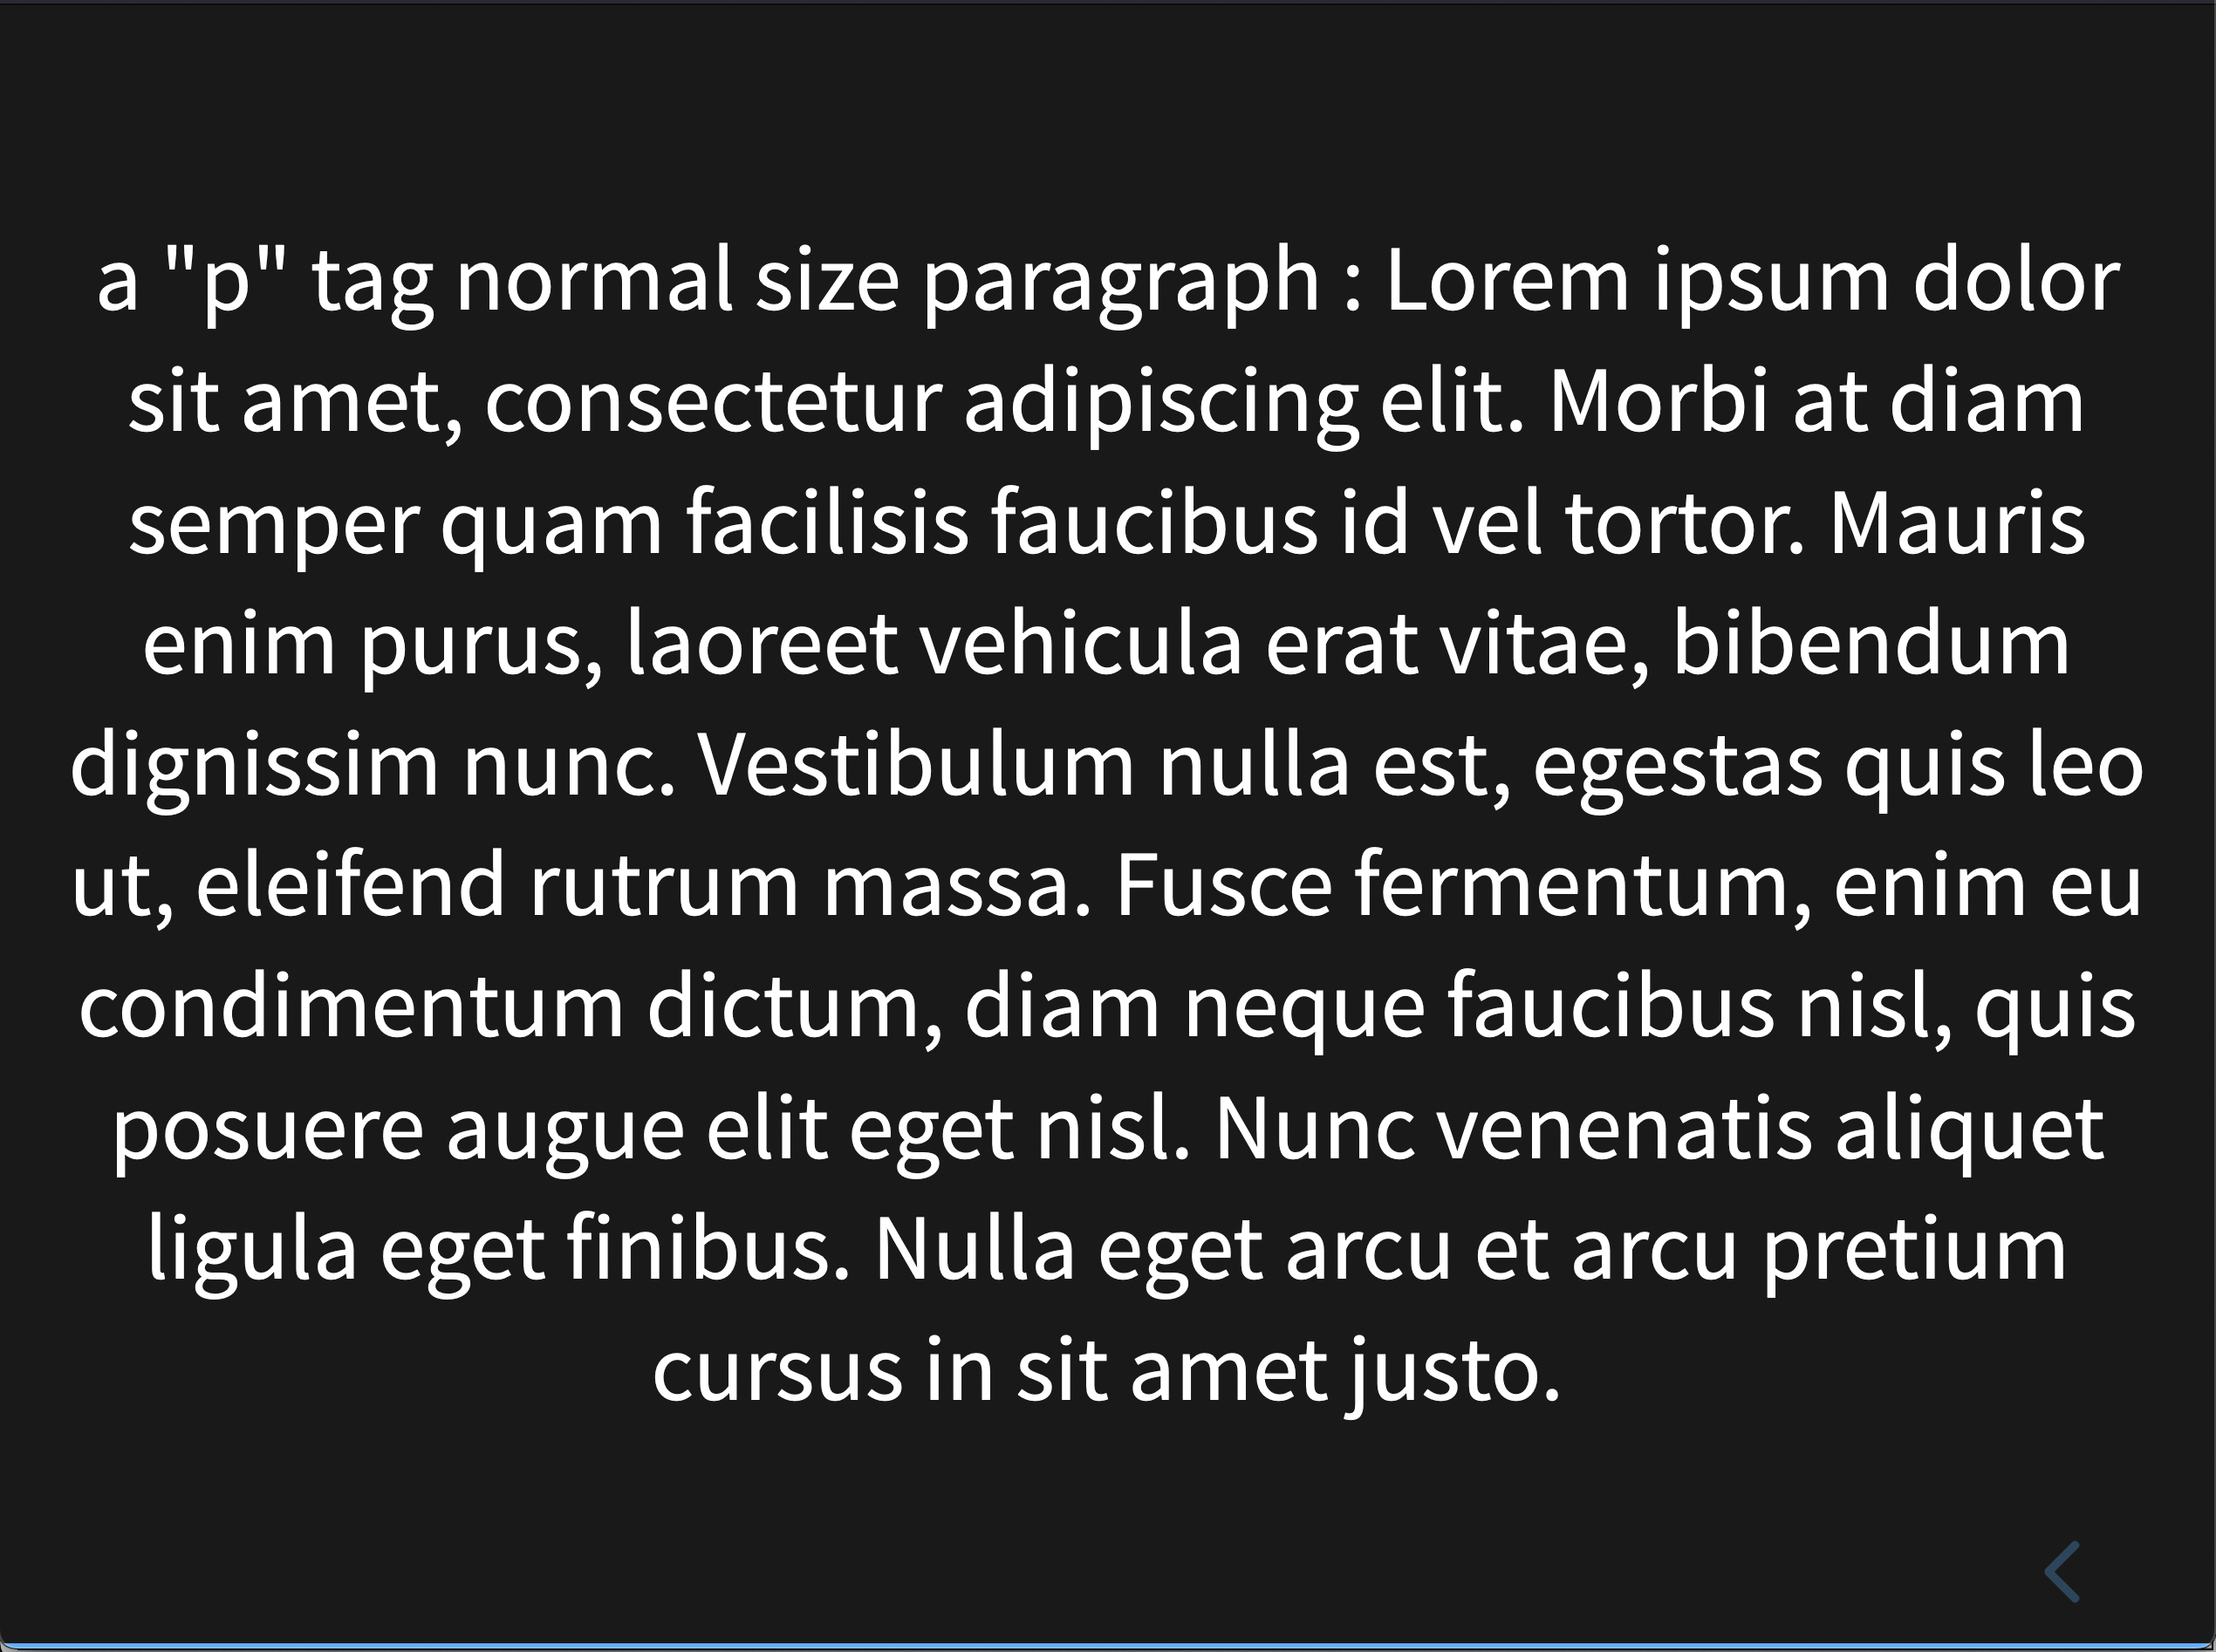
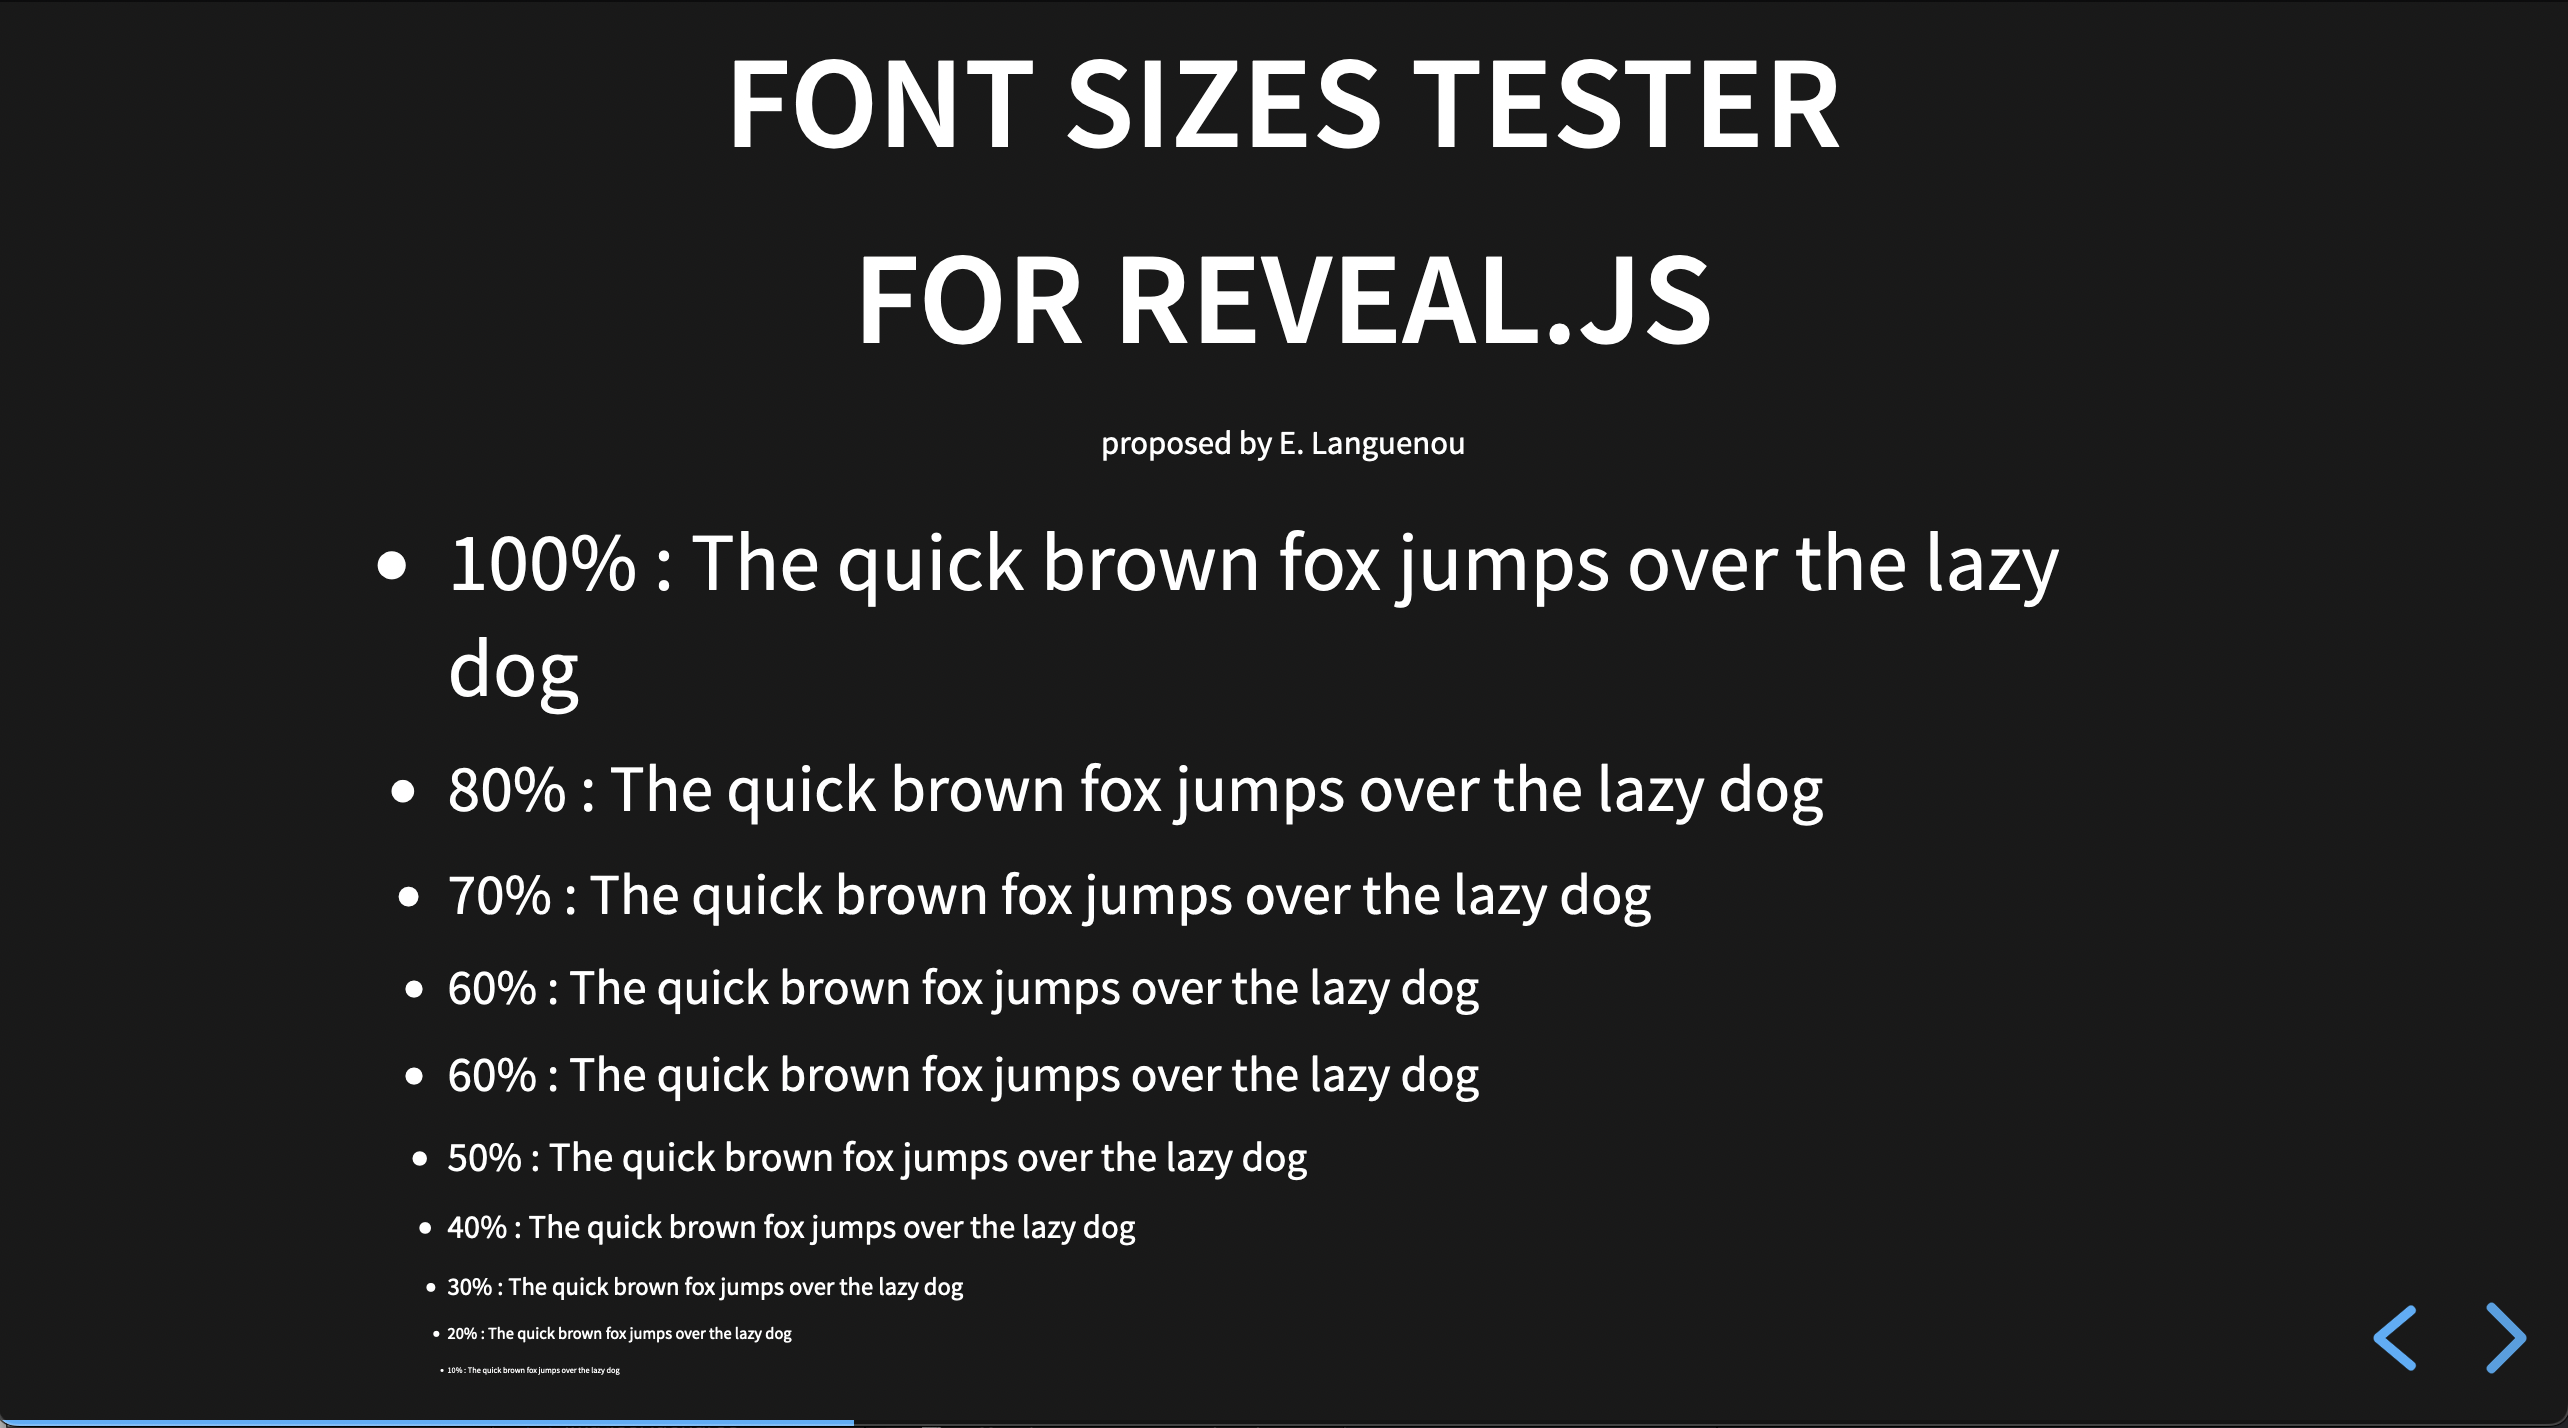
reveal (revealjs, a web-browser based presentation tool)
a page created in illustrator which presents variable text sizes with the associated percentages in terms of page height.
To begin with, I used a single font, helvetica, although there are variations in appearance between fonts.
The person organizing the conference or the speaker if he/she has access to the room before the presentation can thus display the pages and visually find out from the back of the room the minimum usable text size.
It is then easy to use it or communicate it, depending on the rooms envisaged.
To download all the pages (6Mo), download
To get only some pages :
reveal js page 4/3 multi Taille , page 4/3 H tags , page 4/3 p tag , page 16/9 multi Taille , page 16/9 H tags , page 16/9 p tag
For Christmas, a little example of augmented reality displayed on smartphone.
To see it, print or display the "marker" hiro which can be reached on site wikimedia
Then display the local web page
AugmentedReality
You must allow the browser to access the camera and make sure that the whole "marker" is visible on the screen.
The Christmas ball comes from :
Model Information:
The AR.js javascript library use comes from
]]>June the 1st 2022. I have published on HAL a research report,
Title: "Importance Driven Color Assignment"
Subtitle: "Importance Driven Color-Group Assignment in Categorical Visualization"
on my latest work about assigning colors to classes for categorical data visualizations.
The pdf file is downloadable (use save as) here
In categorical data visualizations, different values are usually identified by different colors. Finding both the colors to use and what values to associate them with is complicated, but publications exist on this question.
I believe that "data scientists" have preferences about the color palettes to use for categorical data visualizations. For this reason and because it reduces the search space, the presented work uses a color palette provided by the visualization designer. If there are n categories, the user provides the palette containing n colors. All that "remains" then is to find which category to associate each color with.
The problem is still complicated (NP-complete), for n colors there are factorial n assignment possibilities.
n! = 1x2x3x4x...x(n-2)x(n-1)x(n)
These assignments may be seen as permutations. For example, for 3 colors, there are 1x2x3=6 ways to assign them to values: (1,2,3)(1,3, 2)(2,1,3)(2,3,1)(3,1,2)(3,2,1)
To find a solution, past small values such as n<8, it takes too long to try all the permutations (for 10 categories, the number of permutations is 3,628,800). We must therefore try to find a satisfactory solution by heuristic methods.
To model the problem, we devise an energy function (fitness) which takes as input parameters to be tested, and therefore for this problem, a permutation as parameter. This energy function must return a value that is all the greater that the solution described by the parameters is satisfactory.
To build this function, I use two symmetric square matrices.
The first matrix is the "color distance matrix", which contains the n x n distances between palette colors. It is independent of the data.
The element i,j of the color matrix therefore contains the result of the color distance DE2000 (elaborated by the CIE) between the two colors Ci and Cj of the palette. The value is independent of the data and independent of the type of visualization.
The second matrix (size n x n) is called "importance matrix" which codes the importance of having a high color contrast between two classes of the visualization (i.e. between two graphical objects representing classes, or two sets of objects representing the two classes). It is independent of the palette's colors.
The i,j element of the importance matrix contains the need for color contrast between the two (or sets of) objects in the visualization that represent the categories i and j . The value of this element is independent of the colors, but dependent on the type of visualization and the data represented. For example, if two graphical objects are neighbors and of small sizes, the need for color contrast will be high so as not to confuse the two categories if similar colors...
]]>May 2022. A linocut in 5 colors and in reduction
“The crossing” (“La traversée”, in French): a linocut in 5 colors and in reduction.
The reduction comprises the use of a single linoleum plate to print all the colors. We etched new areas of the plate between each color print.
The colors overlap each other. Here, the black areas have therefore been printed in light blue, in medium blue, in blue-green, in dark blue, and finally in black. It is therefore impossible to reprint copies at the end. For this linocut, I printed 14 copies at the beginning and kept only 9 at the end, to which is added an artist’s print.
For the first light blue print, I therefore engraved the plate only on the areas that will remain white. In the photo, the linoleum plate is ready for the first pass. It is visible that I have not yet prepared the color ink.
We then print all the leaves in light blue.
At the bottom left, the prepared color is visible and at the bottom in the middle, the tank for transferring the color to the ink roller. On the other side of the table, the first prints and the roller which is used to press the sheet on the linoleum plate in order to make the ink penetrate the paper. We place the plate on the table, then inked it using a roller. We carrefully (registration is mandatory) place the sheet of paper onto the plate and we pass the inked roller over the sheet.
A tighter plan.
The result after printing the first color, which will therefore be covered on some parts by the other colors in the following steps. Allow to dry before the next pass.
The drawings that I used to reproduce the design on the plate.
Prepared plate for the engraving of the second color printing in medium blue. Hatched areas are those that will not be engraved. The linoleum zones that will be removed correspond to the areas that will remain in light blue in the final print. The next step, medium blue will cover the light blue in places.
The plate being engraved. At the top right, for example, we can see parts that have already been removed.
The plate is ready for the second color printing in medium blue. The “gouges”, on the right which are used to engrave different profiles, different depths.
The medium blue coated plate is ready for printing.
Second color printing in progress.
A few copies printed with the first two colors. We obviously engrave the plate in a reverse way.
The result with the first two colors.
The engraved plate for the third tone: the light blue-green for the body of the swimmer in the image center.
Located below, the area that will be printed in dark blue, is the shadow of the swimmer at the bottom of the pool and at the image top, some parts that will occupy the area in medium blue...
]]>February the 17th, 2023. With the publication of a paper in the conference IVAPP2023, I just publish, on GitLab, an R language package for class-color assignment in categorical visualization.
The package is free to use. Explanations are on the webpage .
Comments by email are welcome.
A design I had in mind for a while and realized at the end of 2021. A nod to my computer sciences colleagues around the world which evokes the forced march, without reflection, towards a digital world. This creation is licensed under Creative Commons (https://creativecommons.org/).
Link to a PDF format file here
Link to an SVG format file here
Link to a DXF format file for a plotter machine. Save as
]]>For Q2021, the 37th Annual Conference Q conference for the Scientific Study of Subjectivity, Claire Gauzente asked me to design a specific font.
![The QdropFont](/images/QdropFont_ressource/bandeauQconferenceV2FonteCouleur.png “The QdropFont“)
I choose to start from a thin font adding droplet to extremities, and reduce the glyphs to uppercase, without accent, to therefore reduce the design necessary time.
A link to the preliminary program (design Claire Gauzente) where the QdropFont I designed.
Upload the font in various formats (save as) there
]]>A web app to type text in light painting mode
I have recently read an article on "etapes” mag (no 213), a French mag, about "BERG”, a graphism and design agency, in London.
There was a work done in association with "Dentsu” about words light painting using a tablet.
A 2D version seemed easy to develop using P5js, the javascript version of Processing.
To test it, one needs two devices: first, a device than can do lightpainting, smartphone with that capability or better choice: a digital reflex camera, which handles open shutter. Second, a smartphone or a tablet, that will display the animation showing parts of the word or sentence.
Link to the test page here
The display smartphone will be displaced in front of the camera during and according to the animation, and ideally, the camera will be static. Several tests will be necessary before getting the correct speed and an acceptable image.
The application uses javascript and all browsers are not equal about javascript performance. On android, firefox seems the best choice. If, when activating the animation, the result animation is too slow, that could be because of the browser...
The web application is minimal:
1) a speed slider showing the relative speed: at 100, the animation will need a displacement of a screen width per second
2) a slot slider showing the relative size of the slot displaying part of the sentence
3) an input zone to type the sentence
4) a big button to activate the animation
Below these parameters, a view (regarding scale) of the necessary movement is shown.
The animation starts one second after activation to allow a correct placement of the smartphone before recording the image.
At the end of the animation, the screen remains black to avoid undesired glitches. To return to the main app screen, a simple click will do.
]]>Hypertubes and reduction operators in constraint solving
The thesis of M. Christie (co-supervised with F. Benhamou) defended in 2003 was the occasion for a theoretical deepening on interval techniques.
We thus integrated the universal quantifier into the toolbox developed by the constrained laboratory team. This correct (proven) and efficient constraint solver works with contraction operators. This way of solving the system is much faster !
The notion of hypertubes
The notion of hypertubes is introduced in the modeling of camera movements and in the resolution. It is a way to connect the elementary movements to each other by introducing binding constraints, on position, speed, angles, etc.
We also extended the specification language. Attached frames were added. This concept allows a restriction of the searches for a solution by specifying a reference mark corresponding to a moving object. For recent results, see Marc Christie’s page.
]]>The problem
In 2000, methods for designing computer-generated image films presented a certain paradox because they involve tools with complex mathematical bases (perspective projection, 3D interpolation curves, complex camera models, movement modelling) and should nevertheless be able to be used by non-specialists (artists). The constraint-driven approach we propose is the opposite of current methods that force the user to build the camera movement step by step. Moreover, it seems natural that the evolution of modelers is accompanied by the considering of an increasingly important part of the basic mechanisms associated with cinematographic design (notions of panning, traveling, rules of composition, etc. .).
The feasibility
We can model naturally these notions as constraint systems. The main problems related to solving constraints for the computation of solutions representing camera movements concern the inherent difficulty of the type of constraints to be solved (non–linearity, continuous domains, trigonometric functions, high-dimensional search space), the dimension temporal (introduction of universally quantified constraints) and the selection of a relevant subset of representative solutions. A static approach using interval arithmetic and evaluation-subdivision A first static view placement approach (static object and camera) made it possible relatively quickly to show the feasibility of the solver. We transform perspective projection formulas using interval functions (see Moore). We then evaluate the search space (3D position and 3D orientation), by applying the projection function (extended to the intervals) which gives an answer in a three-valued domain: true, false, true-false. In the last case, we subdivide the space, evaluate and start again recursively. We got an inner approximation of the solution set, which can then be explored.
The examples show the hyper-tiles that carry solutions, the pie charts showing the camera angle amplitude.
A dynamic approach and the universal quantifier
During F.Jardillier’s DEA internship, we developed a dynamic approach. This version considered the universally quantified operator which is essential to handle constraints such as “object A appears in the window during the first 3 seconds”. Consideration of mobile objects and the mobile camera. The evaluation-subdivision is thus applied to a new dimension: time.
The universal quantifier
We develop a cinematic constraint specification language. The modeling of camera movements uses splines, which allows a characterization of the search space.
]]>