
In April/May 2025, Christophe Hurter (ENAC, Toulouse) and I will present our latest research at the Computer Human Interface (CHI 2025) conference in Yokohama, Japan. Our work focuses on the extraction and analysis of the color-related knowledge embedded in recent AI systems, including deep learning models, large language models, and vision models. To our knowledge, this is the first comprehensive exploration of this topic.
The title of the extended abstract, a "late-breaking work," is: "Foundation Model ColorMap: A Framework for Extracting and Visualizing the Foundation Models’ Color Knowledge."
A short presentation video (in English, 3 minutes long) is available on vimeo.
Another video showcasing results can be found on vimeo.
The corresponding article is accessible on hal.
A) Knowledge Extraction
This protocol first proposes an in-depth exploration of AI models' ability to name colors, indicated either by a hexadecimal code for text-oriented AIs, or within images featuring a graphical shape filled with the same hue for vision-oriented models. As these models are "black boxes," a "stimulus-response-analysis" paradigm is necessary to evaluate their color knowledge.
The choice of the sampling space for the color gamut displayable on screens was made in favor of the "Lab" color space, due to its property of maintaining consistent perceptual density for the human eye. A uniform sampling density along the a and b axes results in a distribution that appears perceptually uniform to human observers.
B) Exploitation of the Extracted Knowledge
The second phase involves utilizing and analyzing the responses within an interactive web application (link), presenting the extraction results through two types of diagrams: the "Lab display" and the "Grid display".
1) The "Lab display" diagram
A color map showing hues at a constant "Lab" luminance:
-
Points and their locations along the "a" and "b" axes for each color name.
-
Contours indicating higher density areas associated with color names.
This allows for a clear visualization of identified color zones and their densities.
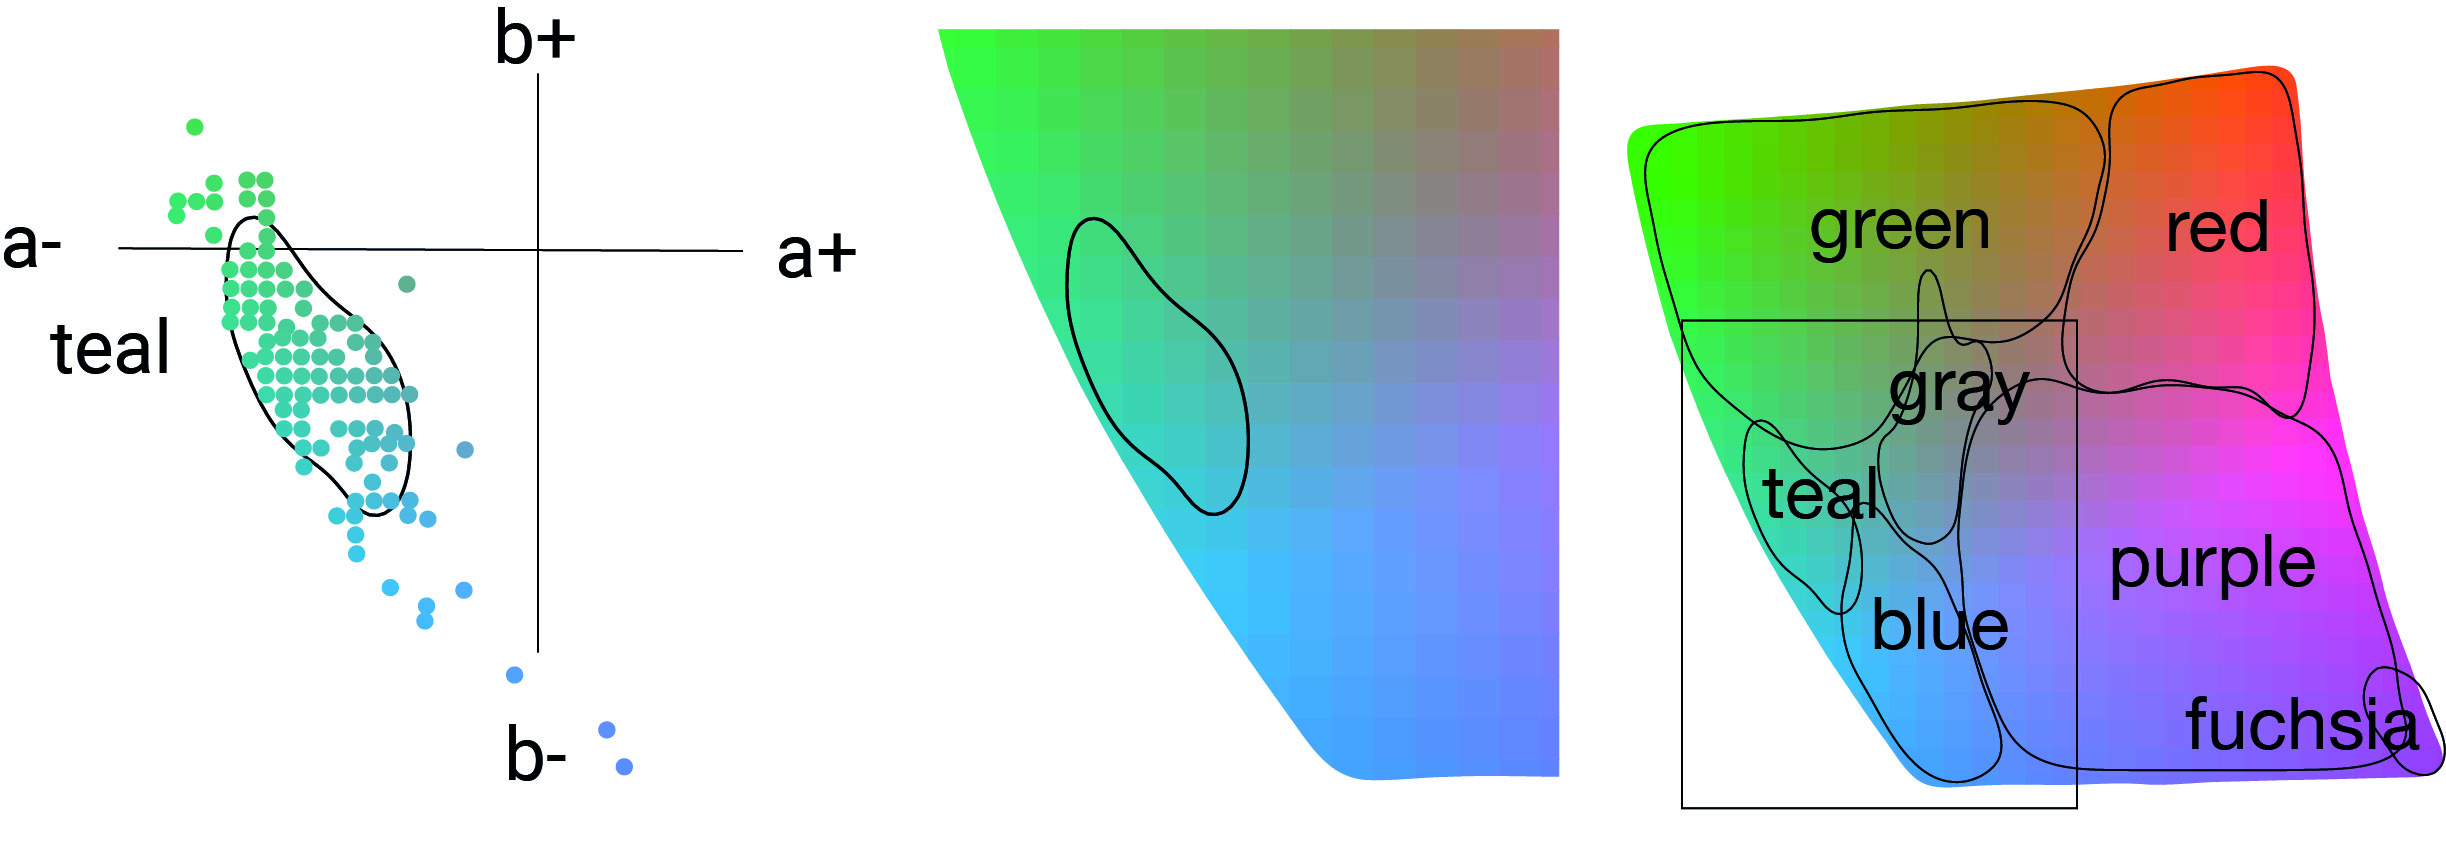
The color points and the generated contour.
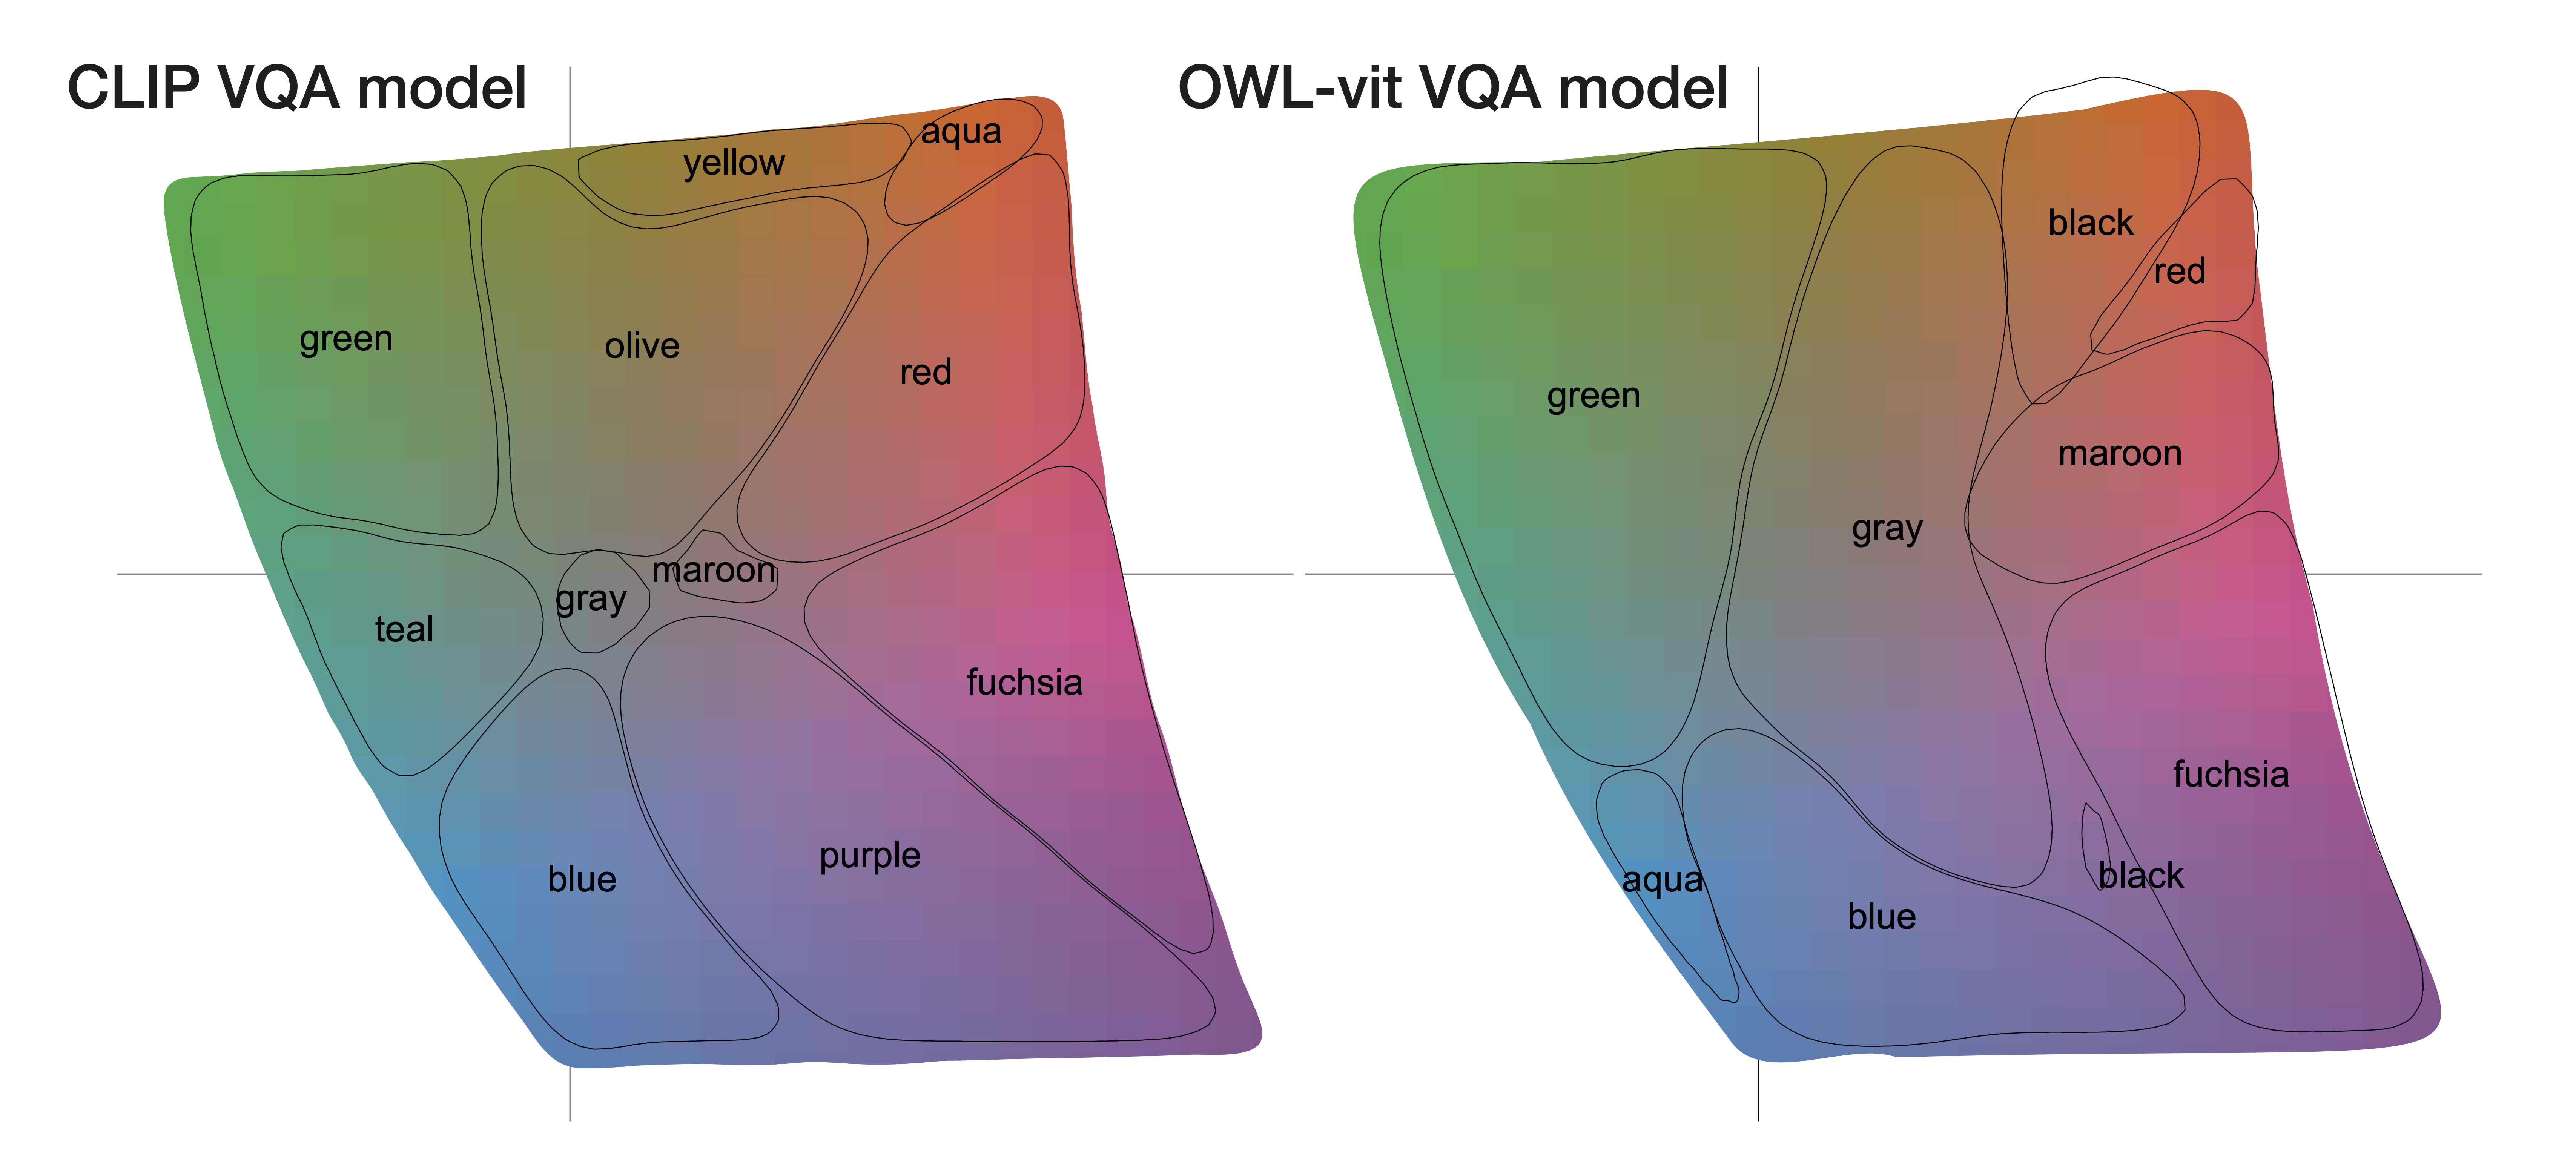 Two results for vision-oriented models: on the left, the OWL-ViT VQA model; on the right, the VQA CLIP model. The color names to choose from are limited to the 16 basic CSS colors ("aqua," "blue," "fuchsia," "gray," "green," "lime," "maroon," "navy," "olive," "purple," "red," "silver," "teal," "white," "yellow").

The far-left plot shows the results from the Llama-3.1-8B-Instruct-Q4 K M model, while the middle plot displays the results of the AIVA/Gemma2-9B-it model. The prompts are based on Multiple Choice Prompting, constrained to the 16 CSS basic color names ("aqua," "blue," "fuchsia," "gray," "green," "lime," "maroon," "navy," "olive," "purple," "red," "silver," "teal," "white," "yellow"). The right part of the figure shows the results of color name identification via hexadecimal values using the mistral-7B-Q4-v0.2 model. The three figures display AI models’ color name extraction for 799 hexadecimal color values, uniformly sampled from a constant Lab (CIE LAB) luminance of 60.
2) The "Grid Display" diagram
A second visualization presents, for each color name, the identified color samples as small colored squares. This diagram clearly highlights mislabeled samples and those that appear correct.
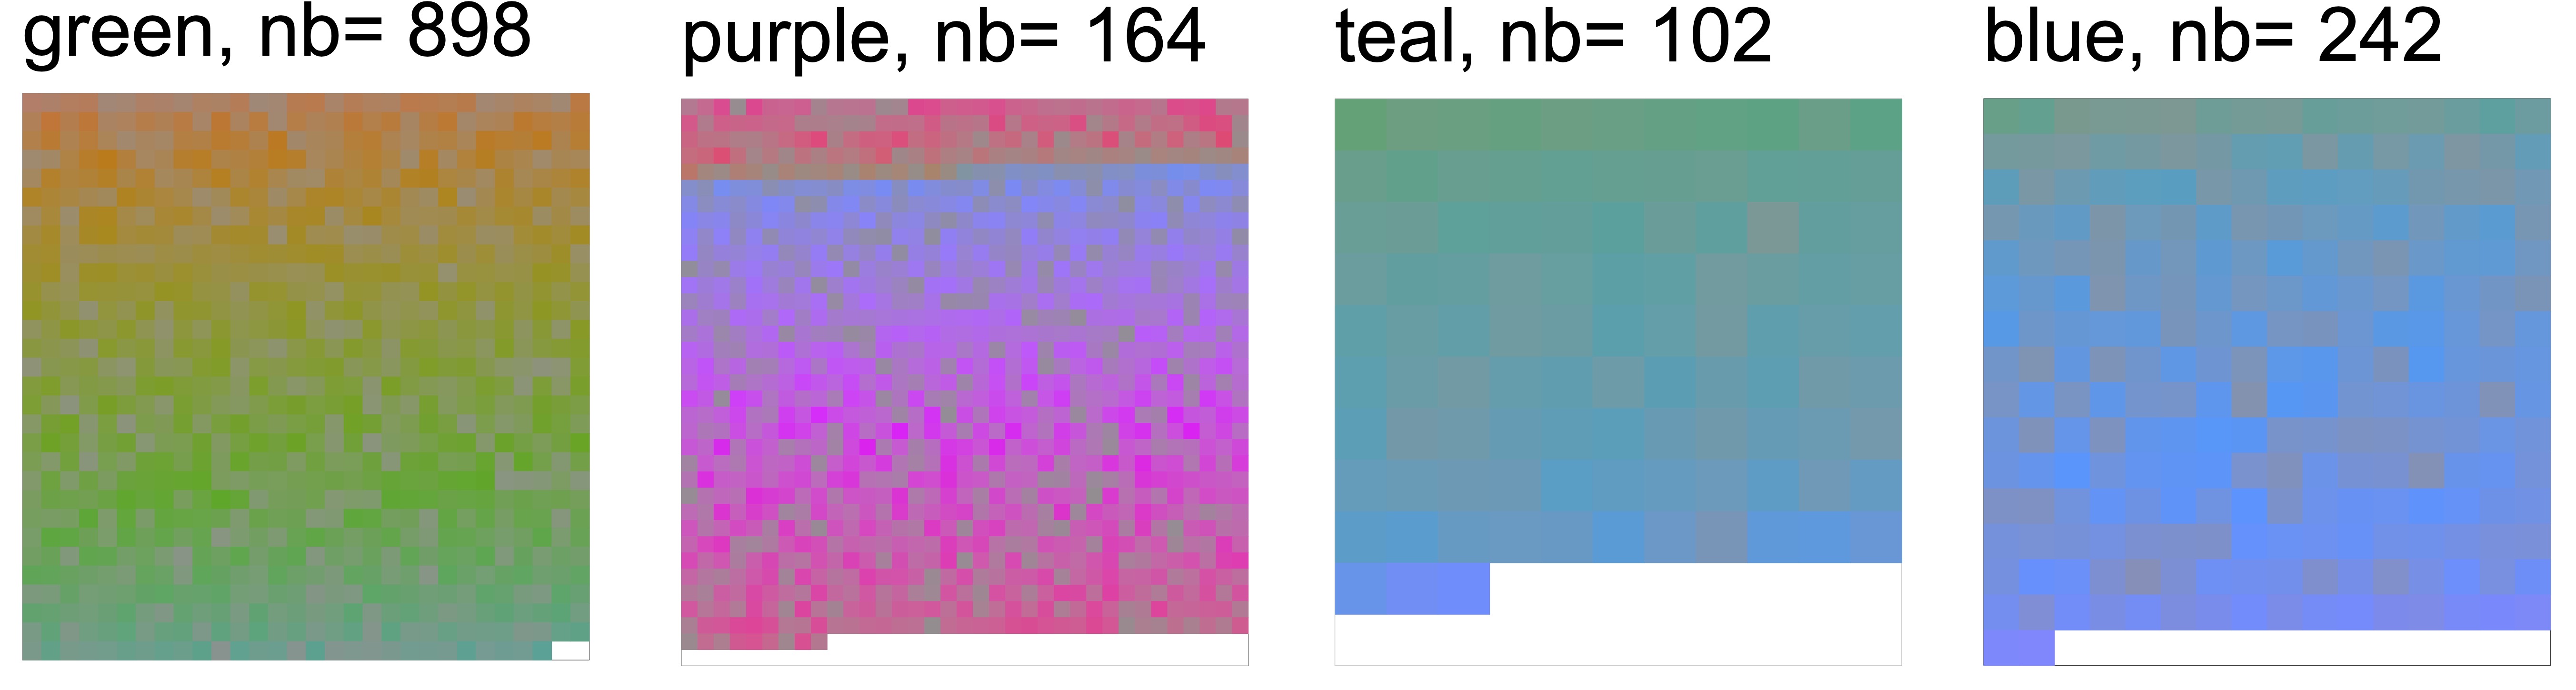 An example of a "grid" display.
Application to "Munsell Charts"
Berlin and Kay constructed a color sampling (different hues, saturations, and brightness levels) to explore color naming across various cultures. The corresponding diagram is known as the "Munsell Color Chart."
Our protocol can thus be used to compare extracted results from AI models against each other and against human data.
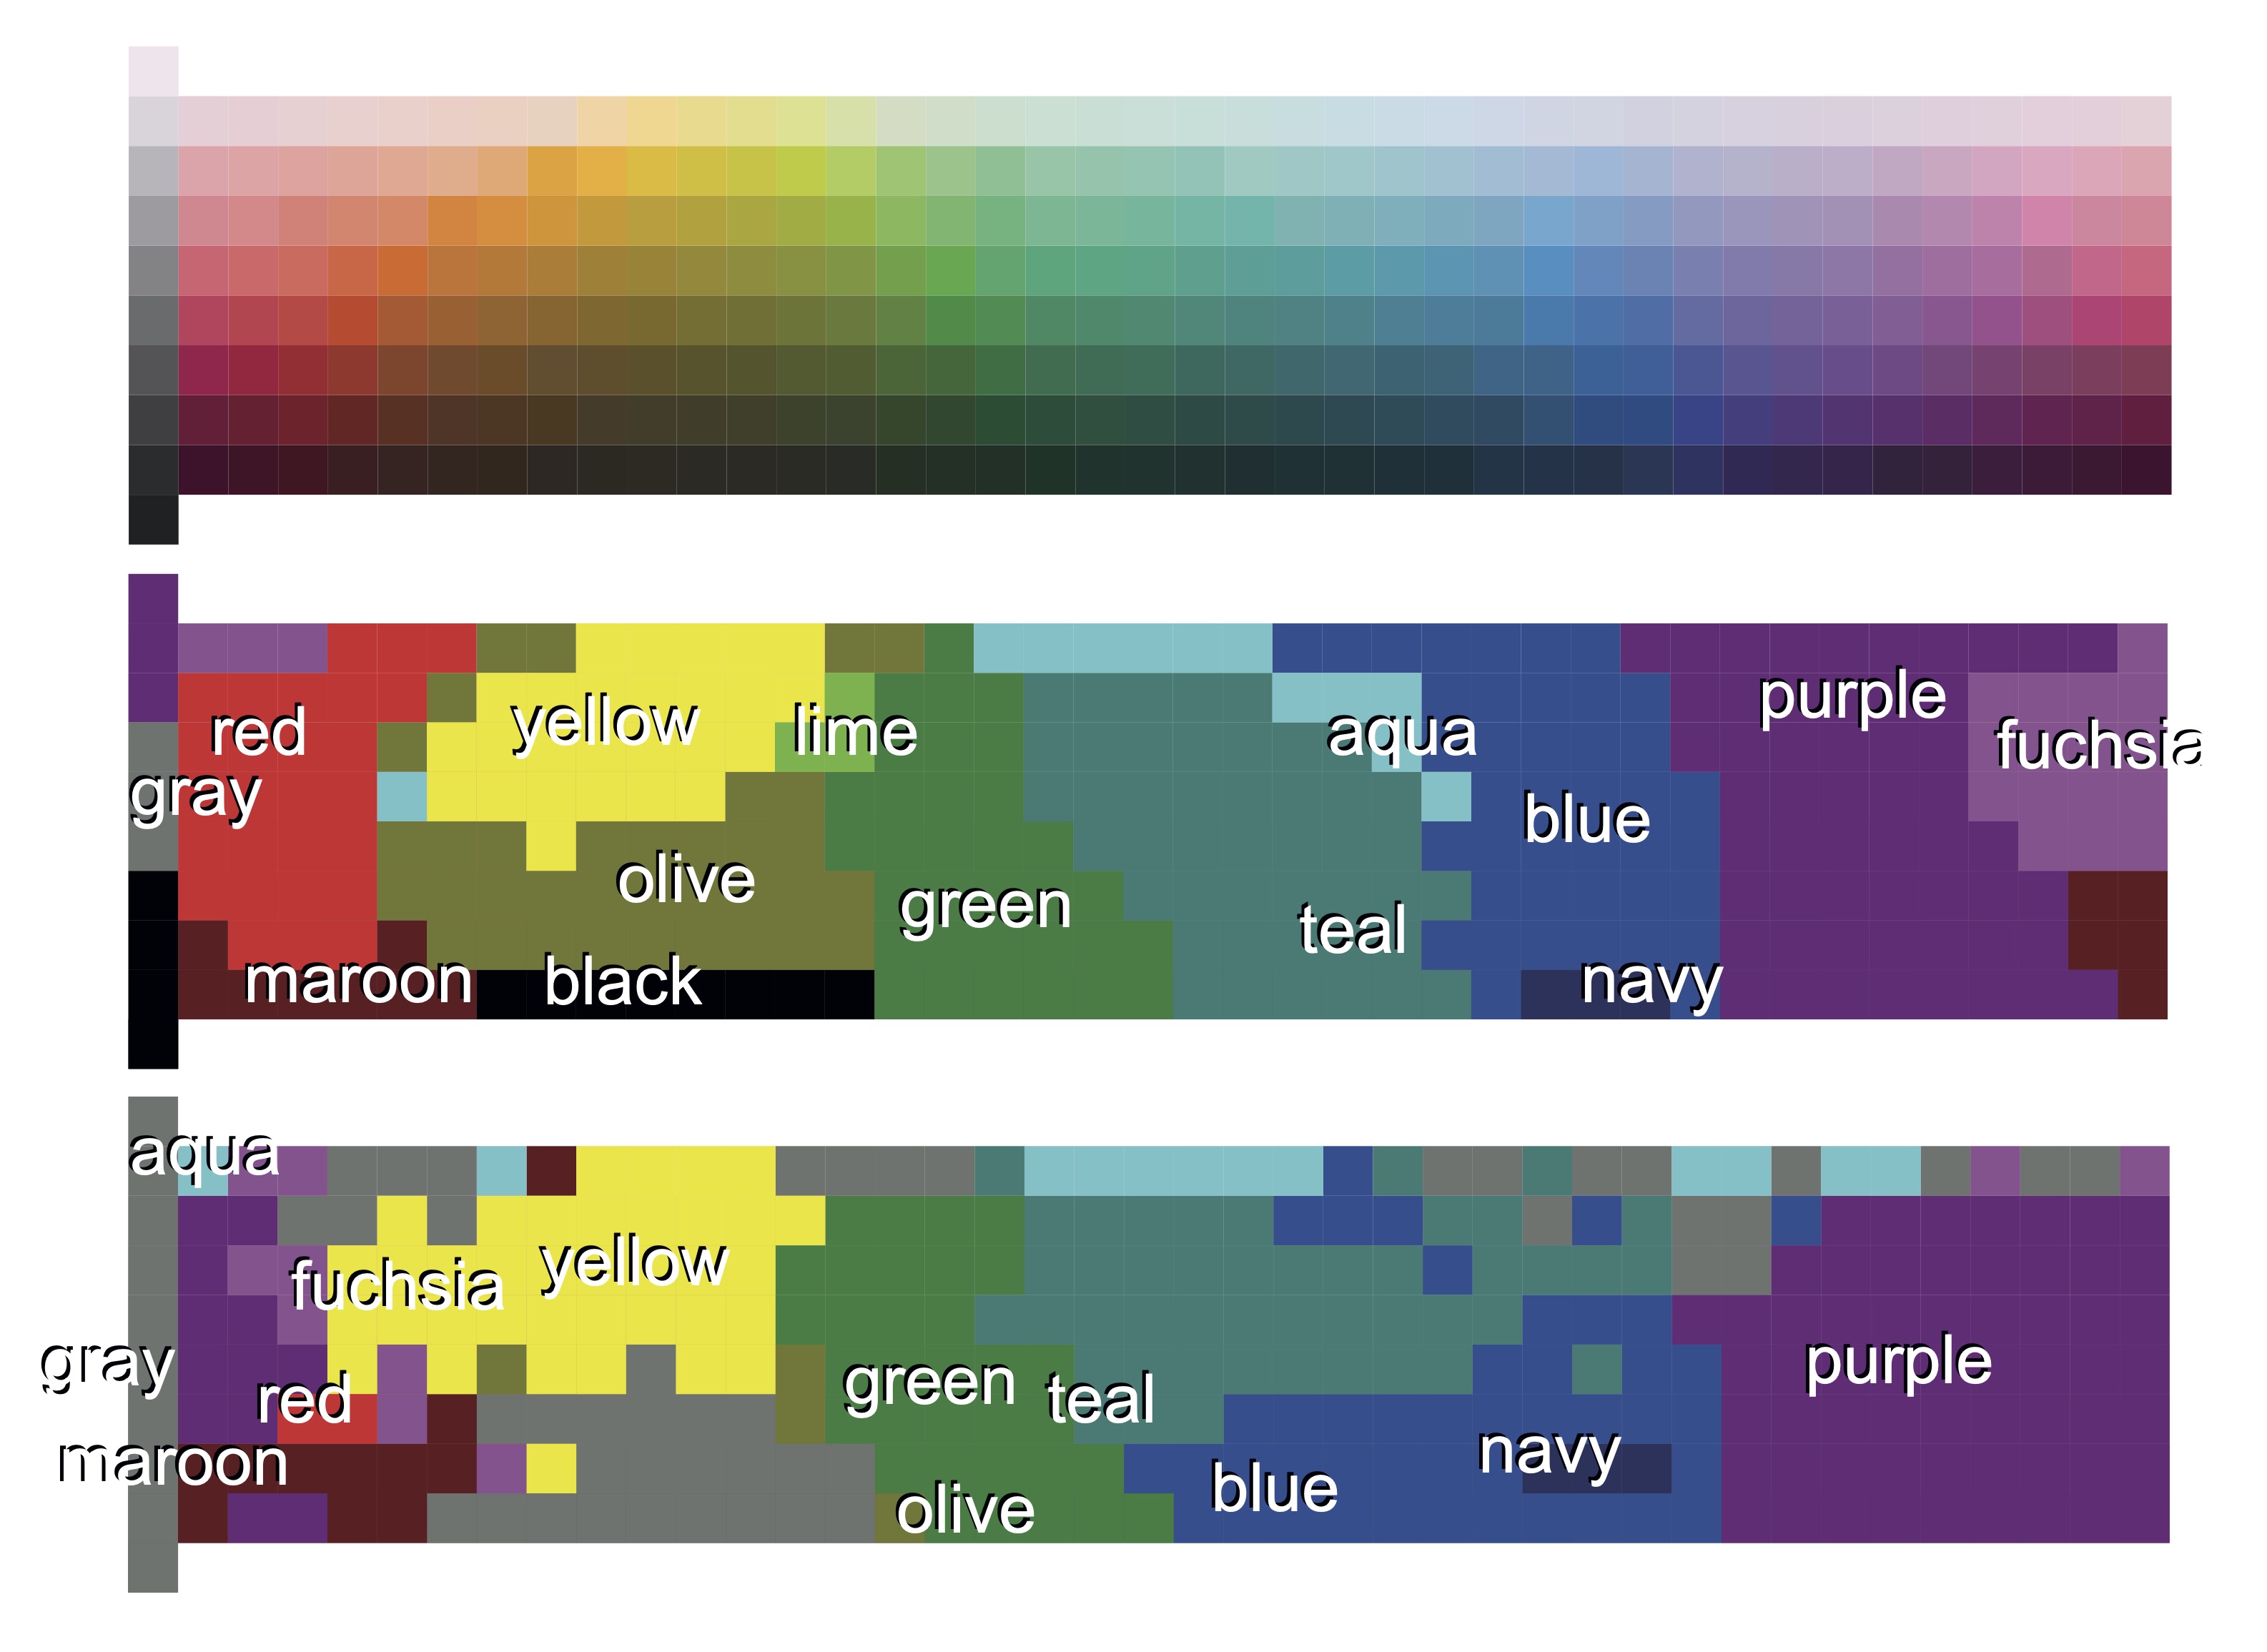
Top: a blank Munsell chart and, below, two results: one using CLIP (a vision-oriented model) and the other using Gemma2 (a text-oriented model). The set of color names was limited to the 16 basic CSS colors ("aqua," "blue," "fuchsia," "gray," "green," "lime," "maroon," "navy," "olive," "purple," "red," "silver," "teal," "white," "yellow").